Tag Archives: feature detection

Finding Corners with SubPixel Accuracy

In the previous blogs, we discussed how to find the corners using algorithms such as Harris Corner, Shi-Tomasi, etc. If you notice, the detected corners had integer coordinates such as (17,34), etc. This generally works if we were extracting these features for recognition purposes but when it comes to some geometrical measurements we need more precise corner locations such as real-valued coordinates (17.35,34.67). So, in this blog, we will see how to refine the corner locations (detected using Harris or Shi-Tomasi Detector) with sub-pixel accuracy.

OpenCV

OpenCV provides a builtin function cv2.cornerSubPix() that finds the sub-pixel accurate location of the corners. Below is the syntax of this

This function uses the dot product trick and iteratively refines the corner locations till the termination criteria is reaches. Let’s understand this in somewhat more detail.

Consider the image shown below. Suppose, q is the starting corner location and p is the point located within the neighborhood of q.

Clearly, the dot product between the gradient at p and the vector q-p is 0. For instance, for the first case because p0 lies in a flat region, so the gradient is 0 and hence the dot product. For the second case, the vector q-p1 lies on the edge and we know that the gradient is perpendicular to the edge so the dot product is 0.

Similarly, we take other points in the neighborhood of q (defined by the winSize parameter) and set the dot product of gradient at that point and the vector to 0 as we did above. Doing so we will get a system of equations. These equations form a linear system that can be solved by the inversion of a single autocorrelation matrix. But this matrix is not always invertible owing to small eigenvalues arising from the pixels very close to q. So, we simply reject the pixels in the immediate neighborhood of q (defined by the zeroZone parameter).

This will give us the new location for q. Now, this will become our starting corner location. Keep iterating until the user-specified termination criterion is reached. I hope you understood this.

Now, let’s take a look at the arguments that this function accepts.

  • image: Input single-channel, 8-bit grayscale or float image
  • corners: Array that holds the initial approximate location of corners
  • winSize: Size of the neighborhood where it searches for corners. This is the Half of the side length of the search window. For example, if winSize=Size(5,5) , then a (5∗2+1)×(5∗2+1)=11×11 search window is used
  • zeroZone: This is the half of the neighborhood size we want to reject. If you don’t want to reject anything pass (-1.-1)
  • criteria: Termination criteria. You can either stop it after a specified number of iterations or a certain accuracy is achieved, or whichever occurs first.

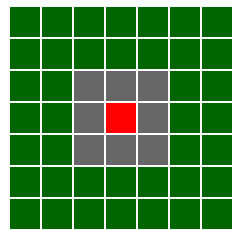
For instance, in the above image the red pixel is the initial corner. The winSize is (3,3) and the zeroZone is (1,1). So, only the green pixels have been considered for generating equations while the grey pixels have been rejected.

Now, let’s take the below image and see how to do this using OpenCV-Python

Steps

  • Load the image and find the corners using Harris Corner Detector as we did in the previous blog. You can use Shi-Tomasi detector also
  • Now, there may be a bunch of pixels at the corner, so we take their centroids
  • Then, we define the stopping criteria and refine the corners to subpixel accuracy using the cv2.cornerSubPix()
  • Finally, we used red color to mark Harris corners and green color to mark refined corners

Below are the results of this. For visualization, I have shown the zoomed in version on the right.

Applications

Subpixel corner locations are a common measurement used in camera calibration or when tracking to reconstruct the camera’s path or the three-dimensional structure of a tracked object or used in some algorithms such as SIFT (discussed in the next blog), etc.

That’s all for this blog. Hope you enjoy reading.

If you have any doubts/suggestions please feel free to ask and I will do my best to help or improve myself. Goodbye until next time.

SIFT: Scale-Space Extrema Detection

In the previous blog, we had an overview of the SIFT algorithm. We discussed different steps involved in this and the invariance that it offers against scale, rotation, illumination, viewpoint, etc. But we didn’t discuss it in detail. So, in this blog, let’s start with the first step which is scale-space extrema detection. So, let’s get started.

Before moving forward, let’s quickly recap what we are doing and why we are doing it and how we are doing it?

  • We saw how the corner detectors like Harris, Shi-Tomasi, etc suffer when it comes to scaling. (Why we are doing)
  • So, we want to detect features that are invariant to scale changes and can be robustly detected (What we are doing)
  • This can be done by searching for stable features (Extremas) across all possible scales, using a continuous function of scale known as scale space. That’s why the name scale-space extrema detection. (How we are doing)

I hope you understood this. Now, let’s understand what is scale-space.

What is a Scale-Space?

As we all know that the real-world objects are composed of different structures at different scales. For instance, the concept of a “tree” is appropriate at the scale of meters, while concepts such as leaves and molecules are more appropriate at finer scales. It would make no sense to analyze leaves or molecules at the scale of the tree (meters). So, this means that you need to analyze everything at an appropriate scale in order to make sense.

But given an image or an unknown scene, there is no apriori way to determine what scales are appropriate for describing the interesting structures in the image data. Hence, the only reasonable approach is to consider descriptions at multiple scales. This representation of images at multiple scales constitutes a so-called scale-space.

How to construct a Scale-Space?

Now, the next thing is how to construct a scale-space? So as we know if we increase the scale, the fine details will be lost and only coarser information prevails. Can you relate this with something you did in image processing? Does Blurring an image with a low pass filter sound similar to this? The answer is yes but there is a catch. We can’t use any low pass filter, only the Gaussian filter helps in mimicking a scale space. This is because the Gaussian filter is shown to be the only filter that obeys the following

  • Linearity
  • Shift-invariance
  • smoothing process does not produce new structures when going from fine to coarser scale
  • Rotational symmetry and some other properties (You can read about it on Wikipedia)

So to create a scale space, you take the original image and generate progressively blurred-out images using a Gaussian filter. Mathematically, the scale-space representation of an image can be expressed as

  • L(x,y,σ) is the blurred image or scale space representation of an image
  • G(x,y,σ) is the Gaussian filter
  • I(x,y) is the image
  • σ is the scaling parameter or the amount of blur. As we increase σ, more and more details are removed from the image i.e. more blur

See below where an image is shown at different scales(σ) (source: Wikipedia). See how at larger scales, the fine details got lost.

So, I hope you understood what is a scale-space and how to construct it using Gaussian filter.

Scale-Space in SIFT

In the SIFT paper, the authors modified the scale-space representation. Instead of creating the scale-space representation for the original image only, they created the scale-space representations for different image sizes. This helps in increasing the number of keypoints detected. The idea is shown below

Take the original image, and generate progressively blurred out images. Then, resize the original image to half size. And generate blurred out images again. And keep repeating. This is shown below

Here, we use the term octave to denote the scale-space representation for a particular image size. For instance, all the same size images in vertical line forms one octave. Here, we have 3 octaves and all the octaves contain 4 images at different scales (blurred using Gaussian filter).

Within an octave, the adjacent scales differ by a constant factor k. If an octave contains s+1 images, then k = 2(1/s). The first image has scale σ0, the second image has scale kσ0, the third image has scale k2σ0, and the last image has scale ksσ0. In the paper, they have used the values as number of octaves = 4, number of scale levels = 5, initial σ0 =1.6, k=√2 etc.

How to decide the number of octaves and number of scales per octave?

The number of octaves and scale depends on the size of the original image. You need to adjust this yourself depending upon the application.

But it has been found out empirically that 3 number of scales sampled per octave provide optimal repeatability under downsampling/upsampling/rotation of the image as well as image noise. Also, Adding more scales per octave will increase the number of detected keypoints, but this does not improve the repeatability (in fact there is a small decrease) – so we settle for the computationally less expensive option. See the below plot

So, once we have constructed the scale-space, the next task is to detect the extrema in this scale-space. That’s why this step is called scale-space extrema detection. To keep this blog short, we will discuss this in the next blog. Hope you enjoy reading.

If you have any doubts/suggestions please feel free to ask and I will do my best to help or improve myself. Goodbye until next time.

Shi-Tomasi Corner Detector

In the previous blog, we discussed the Harris Corner Detector and saw how this uses a score function to evaluate whether a point is a corner or not. But this algorithm doesn’t always yield satisfactory results. So, in 1994, J. Shi and C. Tomasi in their paper Good Features to Track made a small modification to it which shows better results compared to Harris Corner Detector. So, let’s understand how they improved the algorithm.

As you might remember, the scoring function used by Harris Corner Detector is

Instead of this, Shi-Tomasi proposed a new scoring function

So, for a pixel, if this score R is greater than a certain threshold then that pixel is considered as a corner. Similar to Harris Corner Detector if we plot this in λ1−λ2 space, then we will get the below plot

So, as we can see that

  • only when λ1 and λ2 are above a minimum value, λmin, it is considered as a corner(green region)
  • when either λ1 or λ2 are below a minimum value, λmin, it is considered as a edge(orange region)
  • when both λ1 and λ2 are below a minimum value, λmin, it is considered as a flat region(grey region)

So, this is the improvement that Shi-Tomasi did to the Harris Corner Detector. Other than this, the entire algorithm is the same. Now, let’s see how to implement this using OpenCV-Python.

OpenCV

OpenCV provides a built-in function  cv2.goodFeaturesToTrack() that finds N strongest corners in the image by either Shi-Tomasi or Harris Corner Detector. Below is the algorithm that this function uses

  • First, this function calculates the corner quality score at every pixel using either Shi-Tomasi or Harris Corner
  • Then this function performs a non-maximum suppression (the local maximums in 3 x 3 neighborhood are retained).
  • After this, all the corners with the quality score less than qualityLevel*maxx,yqualityScore(x,y) are rejected. This maxx,yqualityScore(x,y) is the best corner score. For instance, if the best corner has the quality score = 1500, and the qualityLevel=0.01 , then all the corners with the quality score less than 15 are rejected.
  • Now, all the remaining corners are sorted by the quality score in the descending order.
  • Function throws away each corner for which there is a stronger corner at a distance less than maxDistance.

Here is the syntax of this function

Now, let’s take the image we used in the previous blog and detect the top 20 corners. Below is the code for this

Below is the result of this

You can also use the Harris Corner Detector method by specifying the flag useHarrisDetector and the k parameter in the above function as shown

So, that’s all about Shi-Tomasi Detector.

Limitations

Both Shi-Tomasi and Harris Corner work well for most of the cases but when the scale of the image changes both of these algorithms doesn’t give satisfactory results. So, in the next blog, we will discuss one of the famous algorithms for finding scale-invariant features known as SIFT (Scale-Invariant Feature Transform). This algorithm was a breakthrough in this field. See you in the next blog. Hope you enjoy reading.

If you have any doubts/suggestions please feel free to ask and I will do my best to help or improve myself. Goodbye until next time.

Harris Corner Detection

In the previous blog, we discussed what are features and how corners are considered as a good feature as compared to edges and flat surfaces. In this blog, let’s discuss one of the famous and most commonly used corner detection methods known as Harris Corner Detection. This was one of the early attempts to find the corners by Chris Harris & Mike Stephens in their paper A Combined Corner and Edge Detector in 1988. Now it is called the Harris Corner Detector. So, let’s first understand the basic idea behind this algorithm, and then we will dive into mathematics. Let’s get started.

As discussed in the previous blog, corners are regions in the image with large variations in intensity in all directions. For instance, take a look at the below image. If you shift the window by a small amount, then corners will produce a significant change in all directions while edges will output no change if we move the window along the edge direction. And the flat region will output no change in all directions on window movement.

So, the authors took this simple idea of finding the difference in intensity for a displacement of (u,v) in all directions into a mathematical form. This is expressed as

Here,

  • the window function is either a rectangular window or a Gaussian window which gives weights to pixels underneath.
  • E(u,v) is the difference in intensities between the original and the moved window.

As can be clearly seen, for nearly constant patches the error function will be close to 0 while for distinctive patches this will be larger. Hence, our aim is to find patches where this error function is large. In other words, we need to maximize this error function for corner detection. That means we have to maximize the second term. We can do this by applying Taylor Expansion and using some mathematical steps as shown below

So, the final equation becomes

Then comes the main part. As we have already discussed that corners are the regions in the image with large variations in intensity in all directions. Or we can say it in terms of the above matrix M as “A corner is characterized by a large variation of M in all directions of the vector [u,v]”. So, if you remember that eigenvalues tell us about the variance thus by simply analyzing the eigenvalues of the matrix M we can infer the results.

But the authors note that the exact computation of the eigenvalues is computationally expensive, since it requires the computation of a square root, and instead suggests the following score function which determines if a window contains a corner or not. This is shown below

Therefore, the algorithm does not have to actually compute the eigenvalue decomposition of the matrix M and instead it is sufficient to evaluate the determinant and trace of matrix M to find the corners.

Now, depending upon the magnitude of the eigenvalues and the score (R), we can decide whether a region is a corner, an edge, or flat.

  • When |R| is small, which happens when λ1 and λ2 are small, the region is flat.
  • When R<0, which happens when λ1>>λ2 or vice versa, the region is edge.
    • If λ1>>λ2, then vertical edge
    • otherwise horizontal edge
  • When R is large, which happens when λ1 and λ2 are large and λ1∼λ2, the region is a corner

This can also be represented by the below image

So, this algorithm will give us a score corresponding to each pixel. Then we need to do thresholding in order to find the corners.

Because we consider only the eigenvalues of the matrix (M), we are considering quantities that are invariant also to rotation, which is important because objects that we are tracking might rotate as well as move. So, this makes this algorithm rotation invariant.

So, this concludes the Harris Corner Detector. I hope you understood this. Now, let’s see how to do this using OpenCV-Python.

OpenCV

OpenCV provides a builtin function cv2.cornerHarris() that runs the Harris corner detector on the image. Below is the syntax for this.

For each pixel (x,y) it calculates a 2×2 gradient covariance matrix M(x,y) over a blockSize×blockSize neighborhood. Then using this matrix M, this calculates the score for each pixel. Below is the code for this

Below is the result of this.

So, this is how you can implement the Harris Corner Detector using OpenCV-Python. I hope you understood this. In the next blog, we will discuss the Shi-Tomasi algorithm that improves this Harris Corner Detector even further. Hope you enjoy reading.

If you have any doubts/suggestions please feel free to ask and I will do my best to help or improve myself. Goodbye until next time.

Feature Detection, Description, and Matching

In the previous blogs, we discussed different segmentation algorithms such as watershed, grabcut, etc. From this blog, we will start another interesting topic known as Feature Detection, Description, and Matching. This has many applications in the field of computer vision such as image-stitching, object tracking, serving as the first step for many computer vision applications, etc. Over the past few decades, a number of algorithms has been proposed but before diving into these algorithms let’s first understand what in general are the features, and why are important. So, let’s get started.

What is a Feature?

According to Wikipedia, a feature is any piece of information that is relevant for solving any task. For instance, let’s say we have the task of identifying an apple in the image. So, the features useful in this case can be shape, color, texture, etc.

Now, that you know what features are, let’s try to understand which features are more important than others. For this, let’s take the example of image matching. Suppose you are given two images (see below) and your task is to match the rectangle present in the first image with the other. And, let’s say you are given 3 feature points A- flat area, B- edge, and C- corner. So now the question is, which of these is a better feature for matching the rectangle.

Clearly, A is a flat area. So, it’s difficult to find the exact location of this point in the other image. Thus, this is not a good feature point for matching. For B (edge), we can find the approximate location but not the accurate location. So, an edge is, therefore, a better feature compared to the flat area, but not good enough. But we can easily and accurately locate C (corner) in the other image and is thus is considered a good feature. So, corners are considered to be good features in an image. These feature points are also known as interest points.

What is a good feature or interest point?

A good feature or interest point is one that is robust to changes in illumination or brightness, scale and can be reliably computed with a high degree of repeatability. And also gives us enough knowledge about the task (see corner feature points for matching above). Also, a good feature should be unique, distinctive, and global.

So, I hope now you have some idea about the features. Now, let’s take a look at some of the applications of Feature Detection, Description, and Matching.

Applications

  • Object tracking
  • Image matching
  • Object Recognition
  • 3D object reconstruction
  • image stitching
  • Motion-based segmentation

All these applications follow the same general steps i.e. Feature Detection, Feature Description, and Feature Matching. All these steps are discussed below.

Steps

First, we detect all the feature points. This is known as Feature Detection. There are several algorithms developed for this such as

  • Harris Corner
  • SIFT(Scale Invariant Feature Transform)
  • SURF(Speeded Up Robust Feature)
  • FAST(Features from Accelerated Segment Test)
  • ORB(Oriented FAST and Rotated BRIEF)

We will discuss each of these algorithms in detail in the next blogs.

Then we describe each of these feature points. This is known as Feature Description. Suppose we have 2 images as shown below. Both of these contain corners. So, the question is are they the same or different.

Obviously, both are different as the first one contains a green area to the lower right while the other one has a green area to the upper right. So, basically what you did is you described both these features and that has led us to answer the question. Similarly, a computer also should describe the region around the feature so that it can find it in other images. So, this is the feature description. There are also several algorithms for this such as

  • SIFT(Scale Invariant Feature Transform)
  • SURF(Speeded Up Robust Feature)
  • BRISK (Binary Robust Invariant Scalable Keypoints)
  • BRIEF (Binary Robust Independent Elementary Features)
  • ORB(Oriented FAST and Rotated BRIEF)

As you might have noticed, that some of the above algorithms were also there in feature detection. These algorithms perform both feature detection and description. We will discuss each of these algorithms in detail in the next blogs.

Once we have the features and their descriptors, the next task is to match these features in the different images. This is known as Feature Matching. Below are some of the algorithms for this

  • Brute-Force Matcher
  • FLANN(Fast Library for Approximate Nearest Neighbors) Matcher

We will discuss each of these algorithms in detail in the next blogs. Hope you enjoy reading.

If you have any doubts/suggestions please feel free to ask and I will do my best to help or improve myself. Goodbye until next time.