Intensity transformation as the name suggests, we transform the pixel intensity value using some transformation function or mathematical expression.
Intensity transformation operation is usually represented in the form
s = T(r)
where, r and s denotes the pixel value before and after processing and T is the transformation that maps pixel value r into s.
Basic types of transformation functions used for image enhancement are
Linear (Negative and Identity Transformation)
Logarithmic (log and inverse-log transformation)
Power law transformation
The below figure summarize these functions. Here, L denotes the intensity value (for 8-bit, L = [0,255])
source: R. C. Gonzalez, R. E. Woods, Digital Image Processing
This is a spatial domain technique which means that all the operations are done directly on the pixels. Also known as a point processing technique (output depend only on the single pixel) as opposed to neighborhood processing techniques(like filtering) which we will discuss later.
Applications:
To increase the contrast between certain intensity values or image regions.
For image thresholding or segmentation
In the next blog, we will discuss these different transformation functions in detail. Hope you enjoy reading.
If you have any doubt/suggestion please feel free to ask and I will do my best to help or improve myself. Good-bye until next time.
In the last blog, we discussed what is Bi-linear interpolation and how it is performed on images. In this blog, we will learn Bi-cubic interpolation in detail.
Bi-linear uses 4 nearest neighbors to determine the output, while Bi-cubic uses 16 (4×4 neighbourhood).
Weight distribution is done differently.
So, the only thing we need to know is how weights are distributed and rest is same as Bi-linear.
In OpenCV, weights are distributed according to the following code (whole code can be found here)
1
2
3
4
5
6
constfloatA=-0.75f;
coeffs[0]=((A*(x+1)-5*A)*(x+1)+8*A)*(x+1)-4*A;
coeffs[1]=((A+2)*x-(A+3))*x*x+1;
coeffs[2]=((A+2)*(1-x)-(A+3))*(1-x)*(1-x)+1;
coeffs[3]=1.f-coeffs[0]-coeffs[1]-coeffs[2];
x used in the above code is calculated from below code where x = fx
1
2
3
fx=(float)((dx+0.5)*scale_x-0.5);
sx=cvFloor(fx);
fx-=sx;
Similarly, for y, replace x with fy and fy can be obtained by replacing dx and scale_x in the above code by dy and scale_y respectively (Explained in the previous blog).
Note: For Matlab, use A= -0.50
Let’s see an example. We take the same 2×2 image from the previous blog and want to upscale it by a factor of 2 as shown below
Steps:
In the last blog, we calculated for P1. This time let’s take ‘P2’. First, we find the position of P2 in the input image as we did before. So, we find P2 coordinate as (0.75,0.25) with dx = 1 and dy=0.
Because cubic needs 4 pixels (2 on left and 2 on right) so, we pad the input image.
OpenCV has different methods to add borders which you can check here. Here, I used cv2.BORDER_REPLICATE method. You can use any. After padding the input image looks like this
After padding, Blue square is the input image
To find the value of P2, let’s first visualize where P2 is in the image. Yellow is the input image before padding. We take the blue 4×4 neighborhood as shown below
For P2, using dx and dy we calculate fx and fy from code above. We get, fx=0.25 and fy=0.75
Now, we substitute fx and fy in the above code to calculate the four coefficients. Thus we get coefficients = [-0.0351, 0.2617,0.8789, -0.1055] for fy =0.75 and for fx=0.25 we get coefficients = [ -0.1055 , 0.8789, 0.2617, -0.0351]
First, we will perform cubic interpolation along rows( as shown in the above figure inside blue box) with the above calculated weights for fx as -0.1055 *10 + 0.8789*10 + 0.2617*20 -0.0351*20 = 12.265625 -0.1055 *10 + 0.8789*10 + 0.2617*20 -0.0351*20 = 12.265625 -0.1055 *10 + 0.8789*10 + 0.2617*20 -0.0351*20 = 12.265625 -0.1055 *30 + 0.8789*30 + 0.2617*40 -0.0351*40 = 32.265625
Now, using above calculated 4 values, we will interpolate along columns using calculated weights for fy as -0.0351*12.265 + 0.2617*12.265 + 0.8789*12.265 -0.1055*32.625 = 10.11702
Similarly, repeat for other pixels.
The final result we get is shown below:
This produces noticeably sharper images than the previous two methods and balances processing time and output quality. That’s why it is used widely (e.g. Adobe Photoshop etc.)
In the next blog, we will see these interpolation methods using OpenCV functions on real images. Hope you enjoy reading.
If you have any doubt/suggestion please feel free to ask and I will do my best to help or improve myself. Good-bye until next time.
In the previous blog, we learned how to find the pixel coordinate in the input image and then we discussed nearest neighbour algorithm. In this blog, we will discuss Bi-linear interpolation method in detail.
Bi-linear interpolation means applying a linear interpolation in two directions. Thus, it uses 4 nearest neighbors, takes their weighted average to produce the output
So, let’s first discuss what is linear interpolation and how it is performed?
Linear interpolation means we estimate the value using linear polynomials. Suppose we have 2 points having value 10 and 20 and we want to guess the values in between them. Simple Linear interpolation looks like this
More weight is given to the nearest value(See 1/3 and 2/3 in the above figure). For 2D (e.g. images), we have to perform this operation twice once along rows and then along columns that is why it is known as Bi-Linear interpolation.
Algorithm for Bi-linear Interpolation:
Suppose we have 4 pixels located at (0,0), (1,0), (0,1) and (1,1) and we want to find value at (0.3,0.4).
First, find the value along rows i.e at position A:(0,0.4) and B:(1,0.4) by linear interpolation.
After getting the values at A and B, apply linear interpolation for point (0.3,0.4) between A and B and this is the final result.
Let’s see how to do this for images. We take the same 2×2 image from the previous blog and want to upscale it by a factor of 2 as shown below
Same assumptions as we took in the last blog, pixel is of size 1 and is located at the center.
Let’s take ‘P1’. First, we find the position of P1 in the input image. By projecting the 4×4 image on the input 2×2 image we get the coordinates of P1 as (0.25,0.25). (For more details, See here)
Since P1 is the border pixel and has no values to its left, so OpenCV replicates the border pixel. This means the row or column at the very edge of the original is replicated to the extra border(padding). OpenCV has different methods to add borders which you can check here.
So, now our input image (after border replication) looks like this. Note the values in red shows the input image.
To find the value of P1, let’s first visualize where P1 is in the input image (previous step image). Below figure shows the upper left 2×2 input image region and the location of P1 in that.
Image-1
Before applying Bi-linear interpolation let’s see how weights are distributed.
Both Matlab and OpenCV yield different results for interpolation because their weight distribution is done differently. Here, I will only explain for OpenCV.
In OpenCV, weights are distributed according to this equation
1
2
3
fx=(float)((dx+0.5)*scale_x-0.5);
sx=cvFloor(fx);
fx-=sx;
Where dx is the column index of the unknown pixel and fx is the weight that is assigned to the right pixel, 1-fx is given to the left pixel. Scale_x is the ratio of input width by output width. Similarly, for y, dy is the row index and scale_y is the ratio of heights now.
After knowing how weights are calculated let’s get back to the problem again.
For P1, both row and column index i.e dx, and dy =0 so, fx = 0.75 and fy =0.75.
We apply linear interpolation with weights fx for both A and B(See Image-1) as 0.75*10(right) + 0.25*10 = 10 (Explained in the Algorithm above)
Now, for P1 apply linear interpolation between A and B with the weights fy as 0.75*10(B) +0.25*10(A) = 10
So, we get P1 =10. Similarly, repeat for other pixels.
The final result we get is shown below:
This produces smoother results than the nearest neighbor but, the results for sharp transitions like edges, are not ideal.
In the next blog, we will discuss Bi-cubic interpolation. Hope you enjoy reading.
If you have any doubt/suggestion please feel free to ask and I will do my best to help or improve myself. Good-bye until next time.
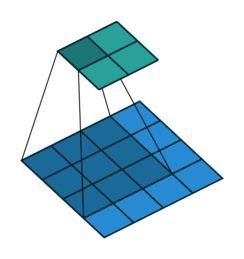
In the previous blog, we discussed image interpolation, its types and why we need interpolation. In this blog, we will discuss the Nearest Neighbour, a non-adaptive interpolation method in detail.
Algorithm: We assign the unknown pixel to the nearest known pixel.
Let’s see how this works. Suppose, we have a 2×2 image and let’s say we want to upscale this by a factor of 2 as shown below.
Let’s pick up the first pixel (denoted by ‘P1’) in the unknown image. To assign it a value, we must find its nearest pixel in the input 2×2 image. Let’s first see some facts and assumptions used in this.
Assumption: a pixel is always represented by its center value. Each pixel in our input 2×2 image is of unit length and width.
Indexing in OpenCV starts from 0 while in matlab it starts from 1. But for the sake of simplicity, we will start indexing from 0.5 which means that our first pixel is at 0.5 next at 1.5 and so on as shown below.
So for the above example, the location of each pixel in input image is {’10’:(0.5,0.5), ’20’:(1.5,0.5), ’30’:(0.5,1.5), ’40’:(1.5,1.5)}.
After finding the location of each pixel in the input image, follow these 2 steps
First, find the position of each pixel (of the unknown image) in the input image. This is done by projecting the 4×4 image on the 2×2 image. So, we can easily find out the coordinates of each unknown pixel e.g location of ‘P1’ in the input image is (0.25,0.25), for ‘P2’ (0.75,0.25) and so on.
Now, compare the above-calculated coordinates of each unknown pixel with the input image pixels to find out the nearest pixel e.g. ‘P1′(0.25,0.25) is nearest to 10 (0.5,0.5) so we assign ‘P1’ value of 10. Similarly, for other pixels, we can find their nearest pixel.
The final result we get is shown in figure below:
This is the fastest interpolation method as it involves little calculation. This results in a pixelated or blocky image. This has the effect of simply making each pixel bigger
Application: To resize bar-codes.
Shortcut: Simply duplicate the rows and columns to get the interpolated or zoomed image e.g. for 2x, we duplicate each row and column 2 times.
In the next blog, we will discuss Bi-linear interpolation method. Hope you enjoy reading.
If you have any doubt/suggestion please feel free to ask and I will do my best to help or improve myself. Good-bye until next time.
Isn’t this an interesting topic? If you have worked with image classification problems( e.g. classifying cats and dogs) or image generation problems( e.g. GANs, autoencoders), surely you have encountered with convolution and deconvolution layer. But what if someone says a deconvolution layer is same as a convolution layer.
This paper has proposed an efficient subpixel convolution layer which works same as a deconvolution layer. To understand this, lets first understand convolution layer , transposed convolution layer and sub pixel convolution layer.
Convolution Layer
In every convolution neural network, convolution layer is the most important part. A convolution layer is consist of numbers of independent filters which convolve independently with input and produce output for the next layer. Let’s see how a filter convolve with the input.
Transposed convolution is the inverse operation of convolution. In convolution layer, you try to extract useful features from input while in transposed convolution, you try to add some useful features to upscale an image. Transposed convolution has learnable features which are learnt using backpropogation. Lets see how to do a transposed convolution visually.
Similarly, a subpixel convolution is also used for upsampling an image. It uses fractional strides( input is padded with in-between zero pixels) to an input and outputs an upsampled image. Let’s see visually.
In this paper authors have proposed that upsampling using deconvolution layer isn’t really necessary. So they came up with this Idea. Instead of putting in between zero pixels in the input image, they do more convolution in lower resolution image and then apply periodic shuffling to produce an upscaled image.
Authors have illustrated that deconvolution layer with kernel size of (o, i, k*r , k*r ) is same as convolution layer with kernel size of (o*r *r, i, k, k) e.g. (output channels, input channels, kernel width, kernel height) in LR space. Let’s take an example of proposed efficient subpixel convolution layer.
In the above figure, input image shape is (1, 4, 4) and upscaling ratio(r) is 2. To achieve an image of size (1, 8, 8), first input image is applied with kernel size of (4, 1, 2, 2) which produces output of shape (4, 4, 4) and then periodic shufling is applied to get required upscaled image of shape (1, 8, 8). So instead of using deconvolution layer with kernel size of (1, 1, 4, 4) same can be done with this efficient sub pixel convolution layer.
Implementation
I have also implemented an autoencoder(using MNIST dataset) with efficient subpixel convolution layer. Let’s see the code for efficient subpixel convolution.
1
2
3
4
5
6
7
8
9
10
11
12
13
14
15
16
17
18
19
20
21
22
23
24
25
26
27
28
29
30
31
32
33
34
35
36
37
38
39
40
41
42
43
44
45
46
47
48
49
50
51
52
53
54
55
56
57
58
59
60
61
62
63
64
65
66
67
68
69
def _phase_shift(I,r):# defines periodical shuffling to upscale image
The above periodic shuffling code is given by this github link. Then applied autoencoder layers to generate image. To up-sample image in decoder layers first convolved encoded images then used periodical shuffling.
This type of subpixel convolution layers can be very helpful in problems like image generation( autoencoders, GANs), image enhancement(super resolution). Also there is more to find out what can this efficient subpixel convolution layer offers.
Now, you might have got some feeling about efficient subpixel convolution layer. Hope you enjoy reading.
If you have any doubt/suggestion please feel free to ask and I will do my best to help or improve myself. Good-bye until next time.
In this blog, we will learn how simple arithmetic operations like addition, subtraction etc can be used for image enhancement. First, let’s start with image addition also known as Image averaging.
Image Averaging
This is based on the assumption that noise present in the image is purely random(uncorrelated) and thus has zero average value. So, if we average n noisy images of same source, the noise will cancel out and what we get is approximately the original image.
Applicability Conditions: Images should be taken under identical conditions with same camera settings like in the field of astronomy.
Advantages: Reduce noise without compromising image details unlike most other operations like filtering.
Disadvantages: Increases time and storage as now one needs to take multiple photos of the same object. Only applicable for random noise. Must follow the above applicability condition.
Below is the code where first I generated 20 images by adding random noise to the original image and then average these images to get the approx. original image.
cv2.randn(image, mean, standard deviation) fills the image with normally distributed random numbers with specified mean and standard deviation.
1
2
3
4
5
6
7
8
9
10
11
12
13
14
15
16
17
18
19
20
21
22
import cv2
import numpy asnp
# Load original image
img=cv2.imread('D:/downloads/forest.jpg')
# Create list to store noisy images
images=[]
# Generate noisy images using cv2.randn. Can use your own mean and std.
for_inrange(20):
img1=img.copy()
cv2.randn(img1,(0,0,0),(50,50,50))
images.append(img+img1)
# For averaging create an empty array, then add images to this array.
This is mainly used to enhance the difference between images. Used for background subtraction for detecting moving objects, in medical science for detecting blockage in the veins etc a field known as mask mode radiography. In this, we take 2 images, one before injecting a contrast medium and other after injecting. Then we subtract these 2 images to know how that medium propagated, is there any blockage or not.
Image Multiplication
This can be used to extract Region of interest (ROI) from an image. We simply create a mask and multiply the image with the mask to get the area of interest. Other applications can be shading correction which we will discuss in detail in the next blogs.
In the next blog, we will discuss intensity transformation, a spatial domain image enhancement technique. Hope you enjoy reading.
If you have any doubt/suggestion please feel free to ask and I will do my best to help or improve myself. Good-bye until next time.
Till now, we learned the basics of an image. From now onwards, we will learn what actually is known as image processing. In this blog, we will learn what is image enhancement, different methods to perform image enhancement and then we will learn how we can perform this on real images.
According to MathWorks, Image enhancement is the process of adjusting digital images so that the results are more suitable for display or further image analysis. It is basically a preprocessing step.
Image enhancement can be done either in the spatial domain or transform domain. Spatial domain means we perform all operations directly on pixels while in transform domain we first transform an image into another domain (like frequency) do processing there and convert it back to the spatial domain by some inverse operations. We will be discussing these in detail in the next blogs.
Both spatial and transform domain have their own importance which we will discuss later. Generally, operations in spatial domain are more computationally efficient.
Processing in spatial domain can be divided into two main categories – one that operates on single pixels known as Intensity transformation and other known as Spatial filtering that works on the neighborhood of every pixel
The following example will motivate you about what we are going to study in the next few blogs
Before Contrast Enhancement
After Contrast Enhancement
In the next blog, we will discuss how basic arithmetic operations like addition, subtraction etc can be used for image enhancement. Hope you enjoy reading.
If you have any doubt/suggestion please feel free to ask and I will do my best to help or improve myself. Good-bye until next time.
Nowadays neural networks are having vast applicability and these are trusted to make complex decisions in applications such as, medical diagnosis, speech recognition, object recognition and optical character recognition. Due to more and more research in deep learning, neural networks accuracy has been improved dramatically.
With the improvement in accuracy, neural network should also be confident in saying when they are likely to be incorrect. As an example, if confidence given by a neural network for disease diagnosis is low, control should be passed to human doctors.
Now what is confidence score in neural network? It is the probability estimate produced by the neural network. Let say, you are working on a multi-class classification task. After applying softmax layer you found out that a particular class is having highest probability with value of 0.7 . It means that you are 70% confident that this should be your actual output.
Here we intuitively mean that, for 100 predictions if average confidence score is 0.8, 80 should be correctly classified. But modern neural networks are poorly calibrated. As you can see in figure there is larger gap between average confidence score and accuracy for ResNet while less for LeNet.
In the paper, author has addresses the followings:
What methods are alleviating poor calibration problem in neural networks.
A simple and straightforward solution to reduce this problem.
Observing Miscalibration:
With the advancement in deep neural networks some recent changes are responsible for miscalibration.
Model Capacity: Although increasing depth and width of neural networks may reduce classification error, but in paper they have observed that these increases negatively affect model calibration.
Batch Normalization: Batch Normalization improves training time, reduces the need for additional regularization, and can in some cases improve the accuracy of networks. It has been observed that models trained with Batch Normalization tend to be more miscalibrated.
Weight Decay: It has been found that that training with less weight decay has a negative impact on calibration.
Temperature Scaling:
Temperature scaling works well to calibrate computer vision models. It is a simplest extension of Platt scaling. To understand temprature scaling we will first see Platt scaling.
Platt Scaling: This method is used for calibrating models. It uses logistic regression to return the calibrated probabilities of a model. Let say you are working on a multi-class classification task and trained it on some training data. Now Platt scaling will take logits(output from trained network before applying softmax layer using validation dataset) as input to logistic regression model. Then Platt scaling will be trained on validation dataset and learns scalar parameters a, b ∈ R and outputs q = σ(az + b) as the calibrated probability(where z are logits.).
Temperature scaling is an extension of Platt scaling having a trainable single parameter T>0 for all classes. T is called the temperature. T is trained with validation dataset not on training dataset. Because if we train T during training, network would learn to make the temperature as low as possible so that it can be very confident on training dataset.
Then temperature will be applied directly to softmax layer by dividing logits with T ( z/T ) and then trained on validation dataset. After adjusting temperature parameter on validation dataset, it will give trained parameter T, which we can use to divide logits and then apply softmax layer to find calibrated probabilities during test data. Now, lets see a simple TensorFlow code to implement temperature scaling.
Simple techniques can effectively remedy the miscalibration phenomenon in neural networks. Temperature scaling is the simplest, fastest, and most straightforward of the methods,and surprisingly is often the most effective.
Python Closures are related to nested functions(a function defined inside another function). As we have discussed in the previous blog, nested functions can access the variables from the enclosing scope that can be modified using the nonlocal keyword.
You cannot call these variables outside their scopes but closure remembers these values even if they are not present in the memory.
Now, let’s see how to define a closure
Python
1
2
3
4
5
6
7
8
9
10
defname(text):# outer enclosing function
defprint_name():# nested function
print(text)
returnprint_name
name_closure=name("Pankaj")
name_closure()
Here, the enclosing function returns the nested function instead of calling it. This returned function was bound to name_closure. On calling name_closure(), the name was still remembered although we had already finished executing the enclosing function.
This can be used for data hiding and a substitute for classes if we have only one method in the class (Always prefer using class over this according to me).
You can check for closure function with the help of __closure__ attribute. This returns a tuple of cell objects if it is a closure function otherwise prints nothing as shown below
When we see a machine learning problem related to an image, the first things comes into our mind is CNN(convolutional neural networks). Different convolutional networks like LeNet, AlexNet, VGG16, VGG19, ResNet, etc. are used to solve different problems either it is supervised(classification) or unsupervised(image generation). Through these years there has been more deeper and deeper CNN architectures are used. As more complex problem comes, more deeper convolutional networks are preferred. But with deeper networks problem of vanishing gradient arises.
encourage feature reuse, and substantially reduce the number of parameters.
How DenseNet works?
Recent researches like ResNet also tries to solve the problem of vanishing gradient. ResNet passes information from one layer to another layer via identity connection. In ResNet features are combined through summation before passing into the next layer.
While in DenseNet, it introduces connection from one layer to all its subsequent layer in a feed forward fashion (As shown in the figure below). This connection is done using concatenation not through summation.
ResNet architecture preserve information explicitly through identity connection, also recent variation of ResNet shows that many layers contribute very little and can in fact be randomly dropped during training. DenseNet architecture explicitly differentiates between information that is added to the network and information that is preserved.
In DenseNet, Each layer has direct access to the gradients from the loss function and the original input signal, leading to an r improved flow of information and gradients throughout the network, DenseNets have a regularizing effect, which reduces overfitting on tasks with smaller training set sizes.
An important difference between DenseNet and existing network architectures is that DenseNet can have very narrow layers, e.g., k = 12. It refers to the hyperparameter k as the growth rate of the network. It means each layer in dense block will only produce k features. And these k features will be concatenated with previous layers features and will be given as input to the next layer.
DenseNet Architecture
The best way to illustrate any architecture is done with the help of code. So, I have implemented DenseNet architecture in Keras using MNIST data set.
A DenseNet consists of dense blocks. Each dense block consists of convolution layers. After a dense block a transition layer is added to proceed to next dense block (As shown in figure below).
Every layer in a dense block is directly connected to all its subsequent layers. Consequently, each layer receives the feature-maps of all preceding layer.
Python
1
2
3
4
5
6
7
defdense_block(block_x,filters,growth_rate):
foriinrange(layers_in_block):
each_layer=conv_layer(block_x,growth_rate)
block_x=concatenate([block_x,each_layer],axis=-1)
filters+=growth_rate
returnblock_x,filters
Each convolution layer is consist of three consecutive operations: batch normalization (BN) , followed by a rectified linear unit (ReLU) and a 3 × 3 convolution (Conv). Also dropout can be added which depends on your architecture requirement.
An essential part of convolutional networks is down-sampling layers that change the size of feature-maps. To facilitate down-sampling in DenseNet architecture it divides the network into multiple densely connected dense blocks(As shown in figure earlier).
The layers between blocks are transition layers, which do convolution and pooling. The transition layers consist of a batch normalization layer and an 1×1 convolutional layer followed by a 2×2 average pooling layer.
DenseNets can scale naturally to hundreds of layers, while exhibiting no optimization difficulties. Because of their compact internal representations and reduced feature redundancy, DenseNets may be good feature extractors for various computer vision tasks that build on convolutional features
Hope you enjoy reading. If you have any doubt/suggestion please feel free to ask and I will do my best to help or improve myself. Good-bye until next time.